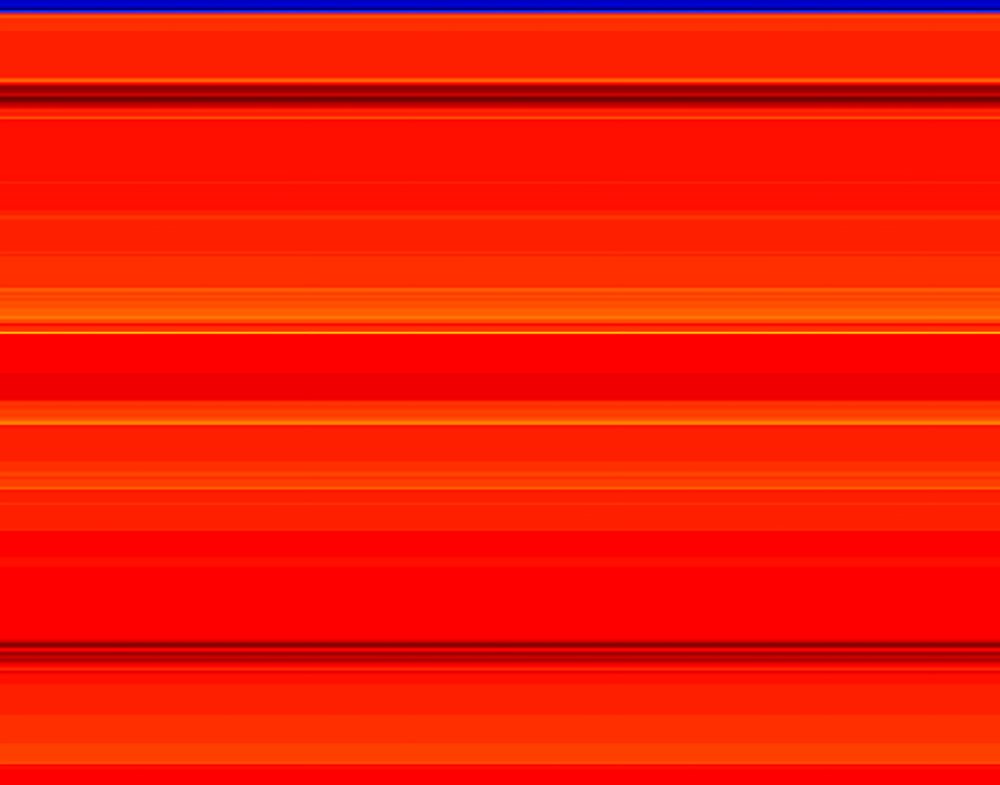
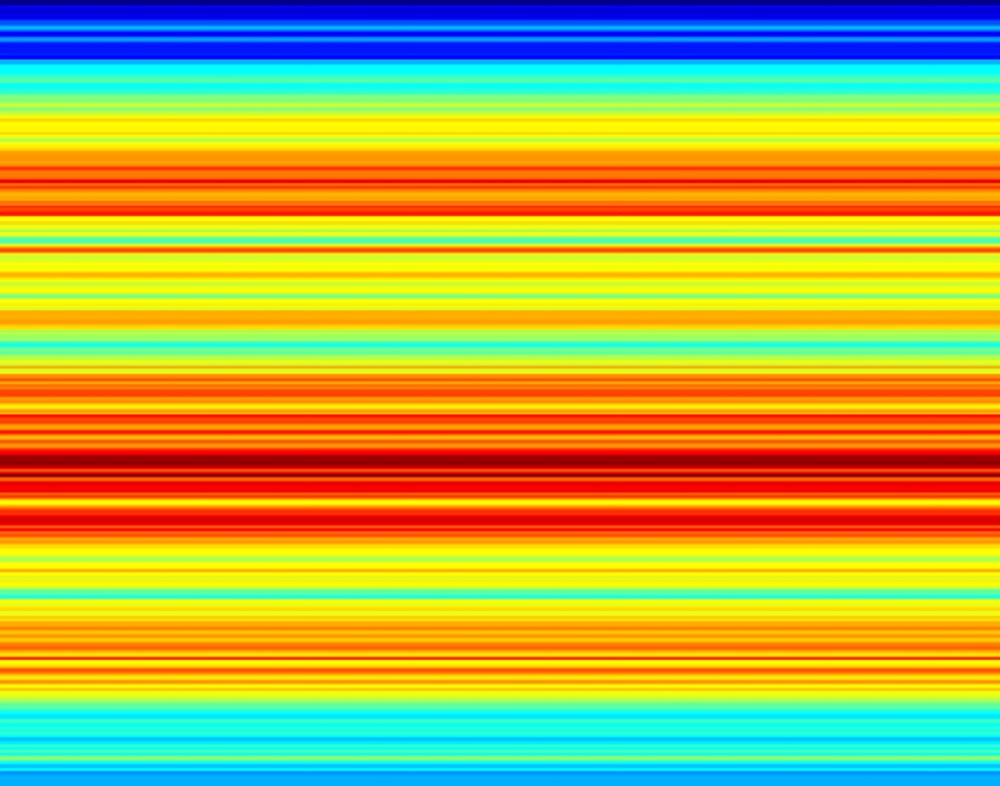
One of a series of randomized images generated from beacon data collected from activations from When it is Necessary to Stand Still (2020). Visualization by Aditya Saluja, 2021.

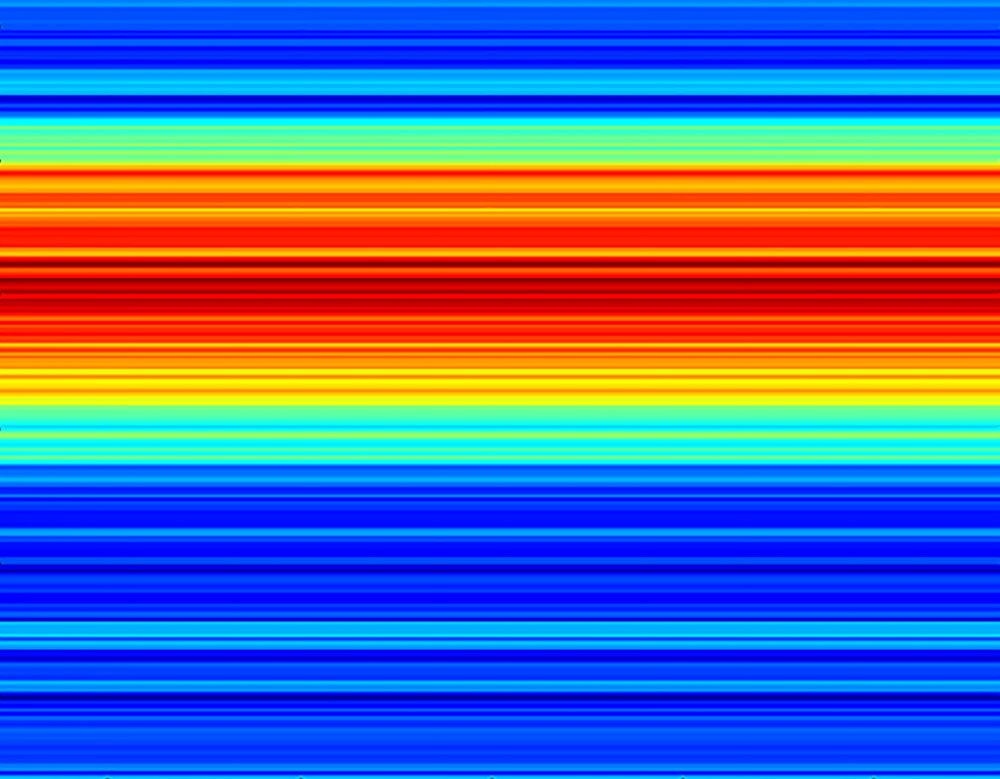
Each minute, the beacons report their GPS location, timestamp, name and its proximity to the other beacons. The example on the left shows data from the beacon ‘Lucilla’. The light states are determine by cumulative distance of all beacons.
Beacon colour chart from Invisible Threads are the Strongest Ties, (2021)
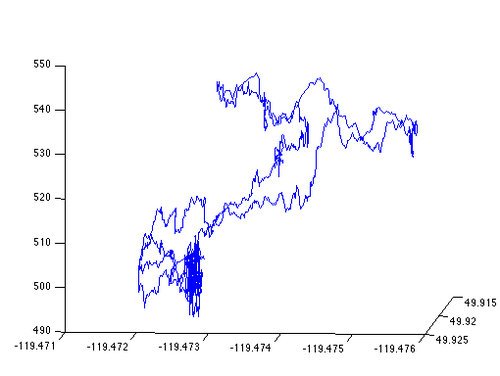
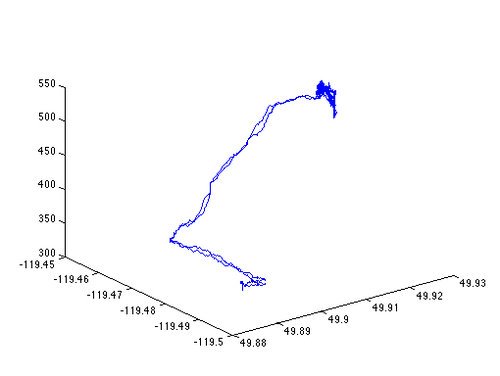
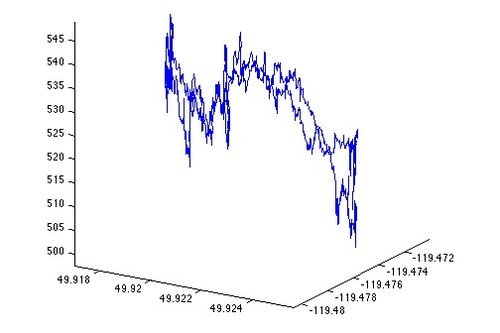
Below are my first experiments of abstracting data. The images below were each created using walking data (latitude, longitude and elevation) generated from data on the right. (2013)